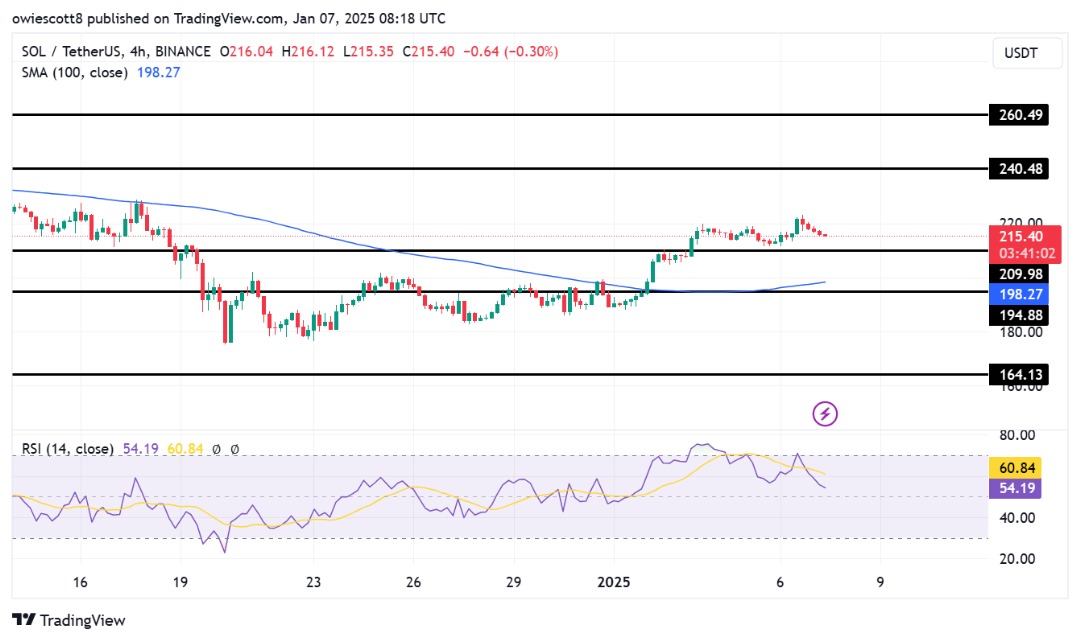
Solana’s powerful surge seems to be slowing down, indicating a possible correction towards the $209.9 support point. Following a stretch of bullish growth, market conditions and profit-taking are causing a temporary halt in its upward momentum. This dip signals a break in the bullish trend, leaving traders and investors on alert for indications of recovery or continued downturn.
The important $209.9 price level is significant for Solana, as whether it can maintain its strength will likely shape the direction of its future price changes. If it successfully defends itself, this could ignite renewed buying activity and potentially cause a surge in prices. Conversely, if this support level breaks, it may initiate more extensive corrections, negatively affecting market sentiment.
A Pullback To $209.9 In Sight For Solana
After a reversal at $223, bears have gained dominance over bulls, causing the price to move towards the significant support point at $209.9. This change in market attitude suggests an increase in selling activity, as bears aim to further reduce the price. The inability of bulls to keep prices above $223 has led to doubts about the robustness of the ongoing upward trend.
At present, attention is centered on the $209.9 support point. This crucial moment in the market could indicate a prolonged downtrend if the price falls below this level. Conversely, if the buyers successfully guard this support and regain dominance, the market might find stability and potentially initiate another upward trend.

The struggle between bulls (optimistic investors) and bears (pessimistic investors) currently focuses on this key support area. The upcoming market behavior will probably indicate whether the asset is trending upward or downward. Traders should stay alert, as the result of this test could significantly influence short-term price fluctuations.
Furthermore, technical signs point towards the current surge potentially weakening, as a minor bearish pattern emerges on the Relative Strength Index (RSI) and buying activity slows down noticeably. A pullback to approximately $209.9 might offer the market a chance to regroup, giving bulls an opportunity to gather strength and strategize for a potential rebound.
Evaluating Crucial Support And Resistance Zones For Price Direction
Identifying crucial support and resistance points is vital for forecasting the potential trend in price fluctuations. In particular, keep an eye on the $209.9, $194, and $164 levels as they could significantly impact the market’s direction.
As a crypto investor, if the price starts to dip, I believe these levels could serve as robust barriers, possibly halting any further falls. However, if the price doesn’t manage to maintain its position at $209.9, it’s crucial to keep an eye on the next potential support level at $194. If the price drops below this point, it might indicate a more significant correction, with $164 being the next key level to watch out for, which could signal a deeper downturn in the market.
In simpler terms, if the bulls regain control at $209.9, the $240 and $260 levels become significant hurdles for the price to overcome. Breaking through these hurdles might lead to a substantial increase in price, potentially pushing it towards the $260 barrier. These levels act as important boundaries, and breaking above them could suggest a prolonged rise, implying that the market’s strength remains steady.

Read More
- Delta Force Redeem Codes (January 2025)
- CNY RUB PREDICTION
- Here Are All of Taylor Swift’s Albums in Order of Release Date (2025 Update)
- List of iOS 26 iPhones: Which iPhones Are Supported?
- Best Heavy Tanks in World of Tanks Blitz (2025)
- Honkai Star Rail 3.4 codes and how to redeem in HSR June 2025
- Death Stranding 2 smashes first game’s Metacritic score as one of 2025’s best games
- Hermanos Koumori Sets Its Athletic Sights on the adidas UltraBOOST 5
- How Many Episodes Are in The Bear Season 4 & When Do They Come Out?
- Vitality Triumphs Over The MongolZ To Win The BLAST.tv Austin Major 2025
2025-01-08 00:04