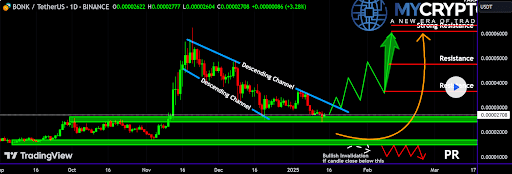
The fluctuations in the BONK price are approaching a crucial support point, and its response could significantly influence whether its future trend will be upward towards challenging its record high of $0.00005825 or if it will continue to drop below $0.00001497, contingent on the upcoming price developments. A thorough technical analysis on the TradingView platform indicates that the cryptocurrency’s current configuration could result in either a bullish surge or a continued slide, based on the evolution of the market action over the next few days.
Descending Channel And Double Bottom Pattern For BONK
For approximately three months now, meme cryptocurrency BONK has predominantly been moving within a downward trending channel, noticeable by the recurring appearance of lower peaks and troughs in its daily candle chart. This bearish pattern took off following BONK’s attainment of an all-time high at $0.00005825 on November 20, 2024.
According to an analyst’s observations on TradingView, the price of BONK is exhibiting signs of a normal pullback following its rejection at a lower high within a downward trending channel. This retreat has led the meme coin to approach a crucial support level approximately $0.000026 within this channel. Remarkably, the recent test of this support level suggests the potential formation of a double bottom pattern, as the chart indicates BONK previously bounced off this level on December 20, 2024.
In simpler terms, for BONK’s price to rise in a bullish trend (double bottom scenario), it’s crucial that there’s confirmation on lower timeframes. This means looking out for a positive shift in market behavior, known as a ‘bullish Internal Change of Character’, which would occur within the current support zone. This change indicates buyers are returning to the market, increasing the chances of BONK breaking free from its current downward trending channel.

Key Price Levels To Watch For BONK Price
In the coming days, it’s important to watch the $0.000026 mark closely as a significant support level for BONK. If BONK shows signs of recovery from this point, the initial step toward a prolonged bullish trend would be breaking above the upper boundary of the downward channel, which could range between $0.000030 and $0.000031.
Once the breakout was verified, the analyst marked out several potential resistance points that BONK might run into as it aimed for a new record high. These points are located at $0.00003657, $0.00004754, and a particularly strong one at $0.00006340.
Additionally, the analyst warns that there’s a possibility of additional price drops or even widespread selling if BONK doesn’t show positive signals in lower timeframes, specifically an I-CHoCH pattern. This situation might lead to a fall below $0.000026 to hit another strong support level. However, even at this level, an I-CHoCH confirmation would be crucial to indicate a potential recovery. Absence of these signals could cast doubt on the bullish forecast.
At the time of writing, BONK is trading at $0.00002863 and is up by 5% in the past 24 hours.

Read More
- Here Are All of Taylor Swift’s Albums in Order of Release Date (2025 Update)
- Death Stranding 2 smashes first game’s Metacritic score as one of 2025’s best games
- List of iOS 26 iPhones: Which iPhones Are Supported?
- Best Heavy Tanks in World of Tanks Blitz (2025)
- CNY RUB PREDICTION
- Delta Force Redeem Codes (January 2025)
- Vitality Triumphs Over The MongolZ To Win The BLAST.tv Austin Major 2025
- [FARM COSMETICS] Roblox Grow a Garden Codes (May 2025)
- Honkai Star Rail 3.4 codes and how to redeem in HSR June 2025
- How Many Episodes Are in The Bear Season 4 & When Do They Come Out?
2025-01-16 20:10