In recent weeks, the beloved Dogecoin has been traversing a bearish path, causing its price to plummet below critical resistance levels around $0.3 and now struggling around $0.2. This downtrend has seen the Relative Strength Index (RSI) indicator trending downwards most dramatically, with the 1-day RSI particularly slipping into oversold territory.
However, a fascinating technical outlook suggests that the Dogecoin price may soon reverse to the upside, reaching an ambitious $0.90 price target.
Dogecoin’s Dance with the Channel Bottom and Oversold RSI
A recent analysis from a TradingView analyst points to a possible buying opportunity as the 1-day RSI slips into oversold territory. Notably, this potential buying opportunity, despite the ongoing decline, is based on the current setup with the RSI and chart pattern, which is reminiscent of past price bottoms for Dogecoin.
Technical analysis reveals that Dogecoin has been moving within a Channel Up pattern for the past year. This pattern has been characterized by a repeated bounce between resistance and support levels. Notably, the current price action shows Dogecoin near the lower boundary of this channel, where past bounces have triggered recoveries.
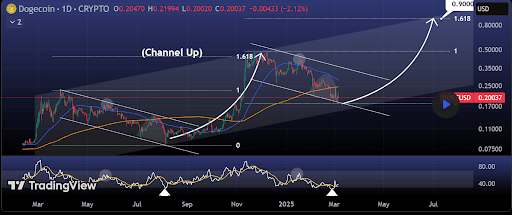
However, the current trading at the lower boundary is more intriguing because of its confluence with the 1-day RSI, which has slipped into oversold territory. This phenomenon mirrors conditions from August 2024, just before Dogecoin went on a remarkable rally between September and December 2024. Furthermore, the bearish wave is under the 1-day MA200 with the 1-day RSI oversold, just like the August 5, 2024 bottom.
1-Day MA200 and Fibonacci Extension Point to $0.90 Target
Based on historical trends, the current price setup suggests that a rally could be on the horizon over the next few weeks. The last time this asset exhibited the same market conditions (trading near the lower boundary of its Channel Up pattern with an oversold 1-day RSI) it experienced a staggering 480% surge, eventually reaching a multi-year peak of $0.475.
Notably, that price peak aligned almost perfectly with the 1.618 Fibonacci extension level when projected from the August 2024 bottom. If a similar scenario unfolds, history could repeat itself with another parabolic rally in the coming months. In this case, the analyst has set $0.90 as a potential target, derived once again from the 1.618 Fibonacci extension, and this time projected from the March low around $0.18.
Beyond price mirroring on the Dogecoin price chart, sentiment surrounding the market is a key factor. Despite the technical target of $0.90 based on the 1.618 Fibonacci extension, achieving this level seems increasingly challenging under current market conditions, especially with bearish pressure mounting on Bitcoin.
Dogecoin’s support between $0.19 and $0.2 is under pressure, and failure to hold this level could trigger a deeper retracement toward $0.16 or even $0.14. At the time of writing, Dogecoin is trading at $0.1972, down by 1.47% in the past 24 hours.

Read More
- Death Stranding 2 smashes first game’s Metacritic score as one of 2025’s best games
- Here Are All of Taylor Swift’s Albums in Order of Release Date (2025 Update)
- Best Heavy Tanks in World of Tanks Blitz (2025)
- CNY RUB PREDICTION
- List of iOS 26 iPhones: Which iPhones Are Supported?
- Delta Force Redeem Codes (January 2025)
- Vitality Triumphs Over The MongolZ To Win The BLAST.tv Austin Major 2025
- Hermanos Koumori Sets Its Athletic Sights on the adidas UltraBOOST 5
- Like RRR, Animal and more, is Prabhas’ The Raja Saab also getting 3-hour runtime?
- Honkai Star Rail 3.4 codes and how to redeem in HSR June 2025
2025-03-09 06:42