Leading cryptocurrency Bitcoin, represented as BTC, currently trades at $94,688. Over the past 24 hours, it has exhibited a volatility of 2.3%. With a market capitalization of $1.88 trillion and a 24-hour trading volume of $62.44 billion, Bitcoin printed a significant series of 14 consecutive hourly candles on Friday – the longest streak since 2017. This prolonged trend suggests that large investors (whales) are actively purchasing during this dip, indicating an increase in buying pressure. As Inauguration Day for the pro-crypto administration approaches, participants within the digital asset market are eagerly anticipating Bitcoin’s next move.
According to the TradingView chart, the 14-hour period spanned from January 9 at 9 PM GMT to January 10 at 11 AM GMT. This unusual rise in Bitcoin’s price has left traders on social media platform X (previously Twitter) perplexed as the prominent cryptocurrency has been trending bearish for the past few days, plummeting to a low of $91,771 before surging back up to a daily high of $95,770.
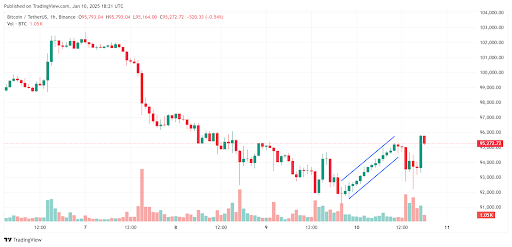
In a recent post on X, Vetle Lunde, a senior analyst at K33 Research, discussed the unusual prolonged increase in Bitcoin’s price action. He pointed out that this is the longest sequence of green hourly candles for the market leader since it recorded 11 such candles on January 1, 2017. The crypto community has hypothesized that an institutional investor might be entering a new Bitcoin position.
A Deeper Dive into Bitcoin Price Action
As per the latest information from CoinMarketCap, Bitcoin is currently priced at approximately $95,078. In the last day, it has increased by 2.52%. However, in the past week, there’s been a decrease of 3.28%, and over the last 30 days, it has dropped by 5.28%. Compared to its all-time high of $108,268 recorded about 27 days ago, Bitcoin is currently 11.74% lower at this moment.
On the provided chart, the Relative Strength Index (RSI) for Bitcoin’s price path shows a value of 46.73, indicating that sellers currently have more power. Yet, the slope of the line hints at buyers attempting to counteract and potentially regain control. This situation may lead to another test near the $100,000 mark.
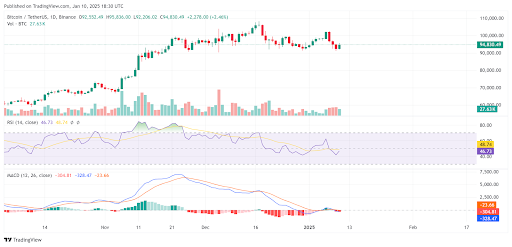
On the daily Bitcoin chart, the MACD indicator signaled a bearish divergence, with the signal line climbing over the MACD line. This suggests a potential downtrend, yet it’s worth noting that the MACD histogram has turned red as well, indicating bearishness. However, since the lines are quite close, there’s a chance for either bulls or bears to take control.
In summary, evidence from Coinglass indicates that a significant sum of $389.50 million was wiped out from the cryptocurrency market when Bitcoin surpassed the $95,000 price mark unexpectedly, causing the overall market to become more optimistic. Over the past 4 hours, approximately $128.23 million has been liquidated, with around $82.70 million of that being associated with BTC short positions.
Read More
- POPCAT PREDICTION. POPCAT cryptocurrency
- Odin Valhalla Rising Codes (April 2025)
- Dig to Earth’s CORE Codes (May 2025)
- King God Castle Unit Tier List (November 2024)
- Who Is Stephen Miller’s Wife? Katie’s Job & Relationship History
- The Righteous Gemstones Season 4: What Happens Kelvin & Keefe in the Finale?
- Bigg Boss Tamil 8 Finale: Did Muthukumaran emerge as the winner of Vijay Sethupathi-hosted show? Find out
- Who Is Ivanka Trump’s Husband? Jared Kushner’s Kids & Relationship History
- What Is ‘Mama Dat Burn’ Meme on TikTok? Explained
- Leaked Video Scandal Actress Shruthi Makes Bold Return at Film Event in Blue Saree
2025-01-11 02:15