In his most recent examination of Bitcoin, renowned crypto expert Christopher Inks identifies potential signs of a bullish Adam and Eve reversal pattern. This pattern, visible on the BTC/USD hourly chart, could significantly influence Bitcoin’s near-term price trend.
The graph shows Bitcoin’s price fluctuation having a distinctive shape akin to two dips with a peak in the middle. The initial dip, referred to as the “Adam,” features a steep, V-shaped curve, representing a quick drop and subsequent sharp rise. Subsequently, there is a gentler, more gradual, and wider “Eve” dip, implying a slower and more deliberate price climb back up.

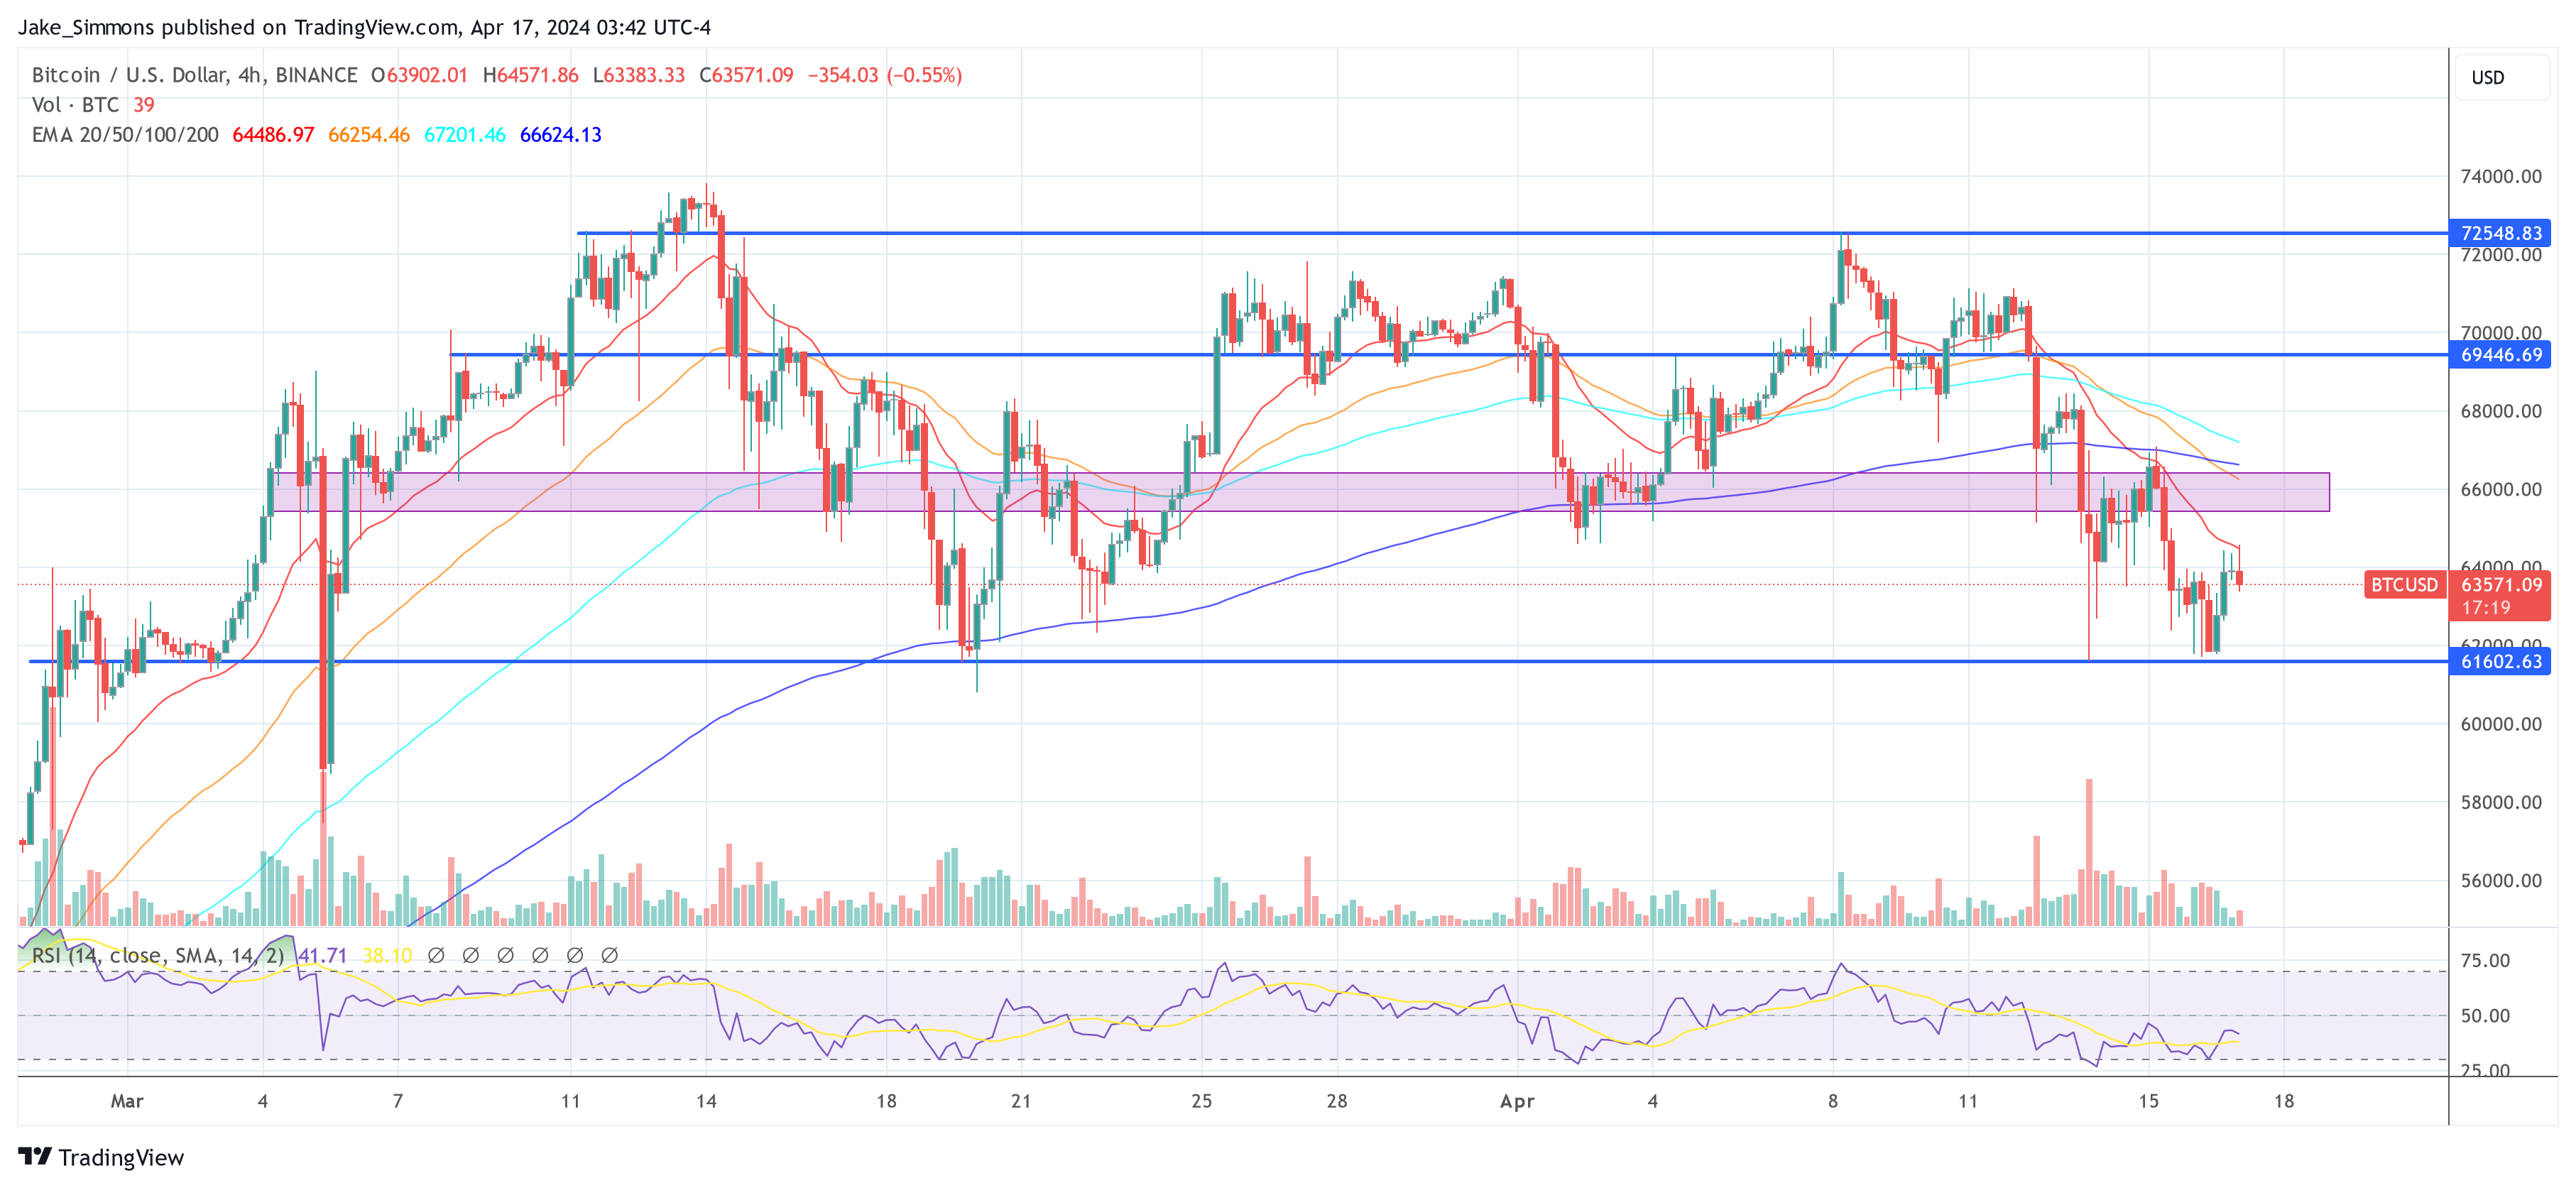
Bitcoin Targets Its All-Time High
In this examination, a horizontally placed yellow line serves as a noteworthy marker for the price level in Inks’ assessment. This line, referred to as the neckline by Inks, could signal a bullish reversal if the price breaks through and closes above it. The significance of reaching this neckline, approximately at $67,000, should not be underestimated since it acts as a significant resistance level that needs to be overcome for the pattern to be confirmed.
Inks determines the goal of the pattern by calculating the depth of the formation, which is measured from the neckline to the Adam trough’s lowest point. This depth amounts to 8.88%. By adding this distance above the breakout point, it can be inferred that the target price for the pattern lies around $73,000, near Bitcoin’s all-time high (ATH).
Other technical indicators on the chart include volume, the Relative Strength Index (RSI), and the Stochastic RSI. Volume, denoted at the bottom of the chart, has shown a significant peak at the formation of the Adam bottom, followed by less pronounced volume during the formation of the Eve. This volume profile often accompanies the Adam and Eve pattern and can serve as a confirmation signal of the bullish sentiment.
The Relative Strength Index (RSI), which calculates the rate of price change and momentum, is currently at 47. This position is considered neutral, signaling that neither bulls nor bears are dominating the market yet. However, the Stochastic RSI, a more responsive indicator that merges stochastic oscillators and RSI, points to robust upward momentum. Its reading of over 95 out of 100 implies significant overbought conditions, potentially indicating a brief correction ahead.
In summary, the Stochastic RSI indicator is signaling a potential correction as it indicates an overbought territory crossover. Yet, the bullish trend suggested by the Adam and Eve formation suggests a positive market sentiment. Should Bitcoin surpass the $67,000 resistance level and close above it, bulls may aim for the all-time high at $73,780.
At press time, BTC traded at $63,571.
Read More
- DBD July 2025 roadmap – The Walking Dead rumors, PTB for new Survivors, big QoL updates, skins and more
- PUBG Mobile Sniper Tier List (2025): All Sniper Rifles, Ranked
- COD Mobile Sniper Tier List Season 4 (2025): The Meta Sniper And Marksman Rifles To Use This Season
- Best Heavy Tanks in World of Tanks Blitz (2025)
- [Guild War V32] Cultivation: Mortal to Immortal Codes (June 2025)
- Here Are All of Taylor Swift’s Albums in Order of Release Date (2025 Update)
- Delta Force Redeem Codes (January 2025)
- Beyoncé Flying Car Malfunction Incident at Houston Concert Explained
- Best ACE32 Loadout In PUBG Mobile: Complete Attachment Setup
- Best Japanese BL Dramas to Watch
2024-04-17 11:10